Assessment Module
The Assessment Module landing page displays all assessments that the user owns or has permission to view and/or edit.
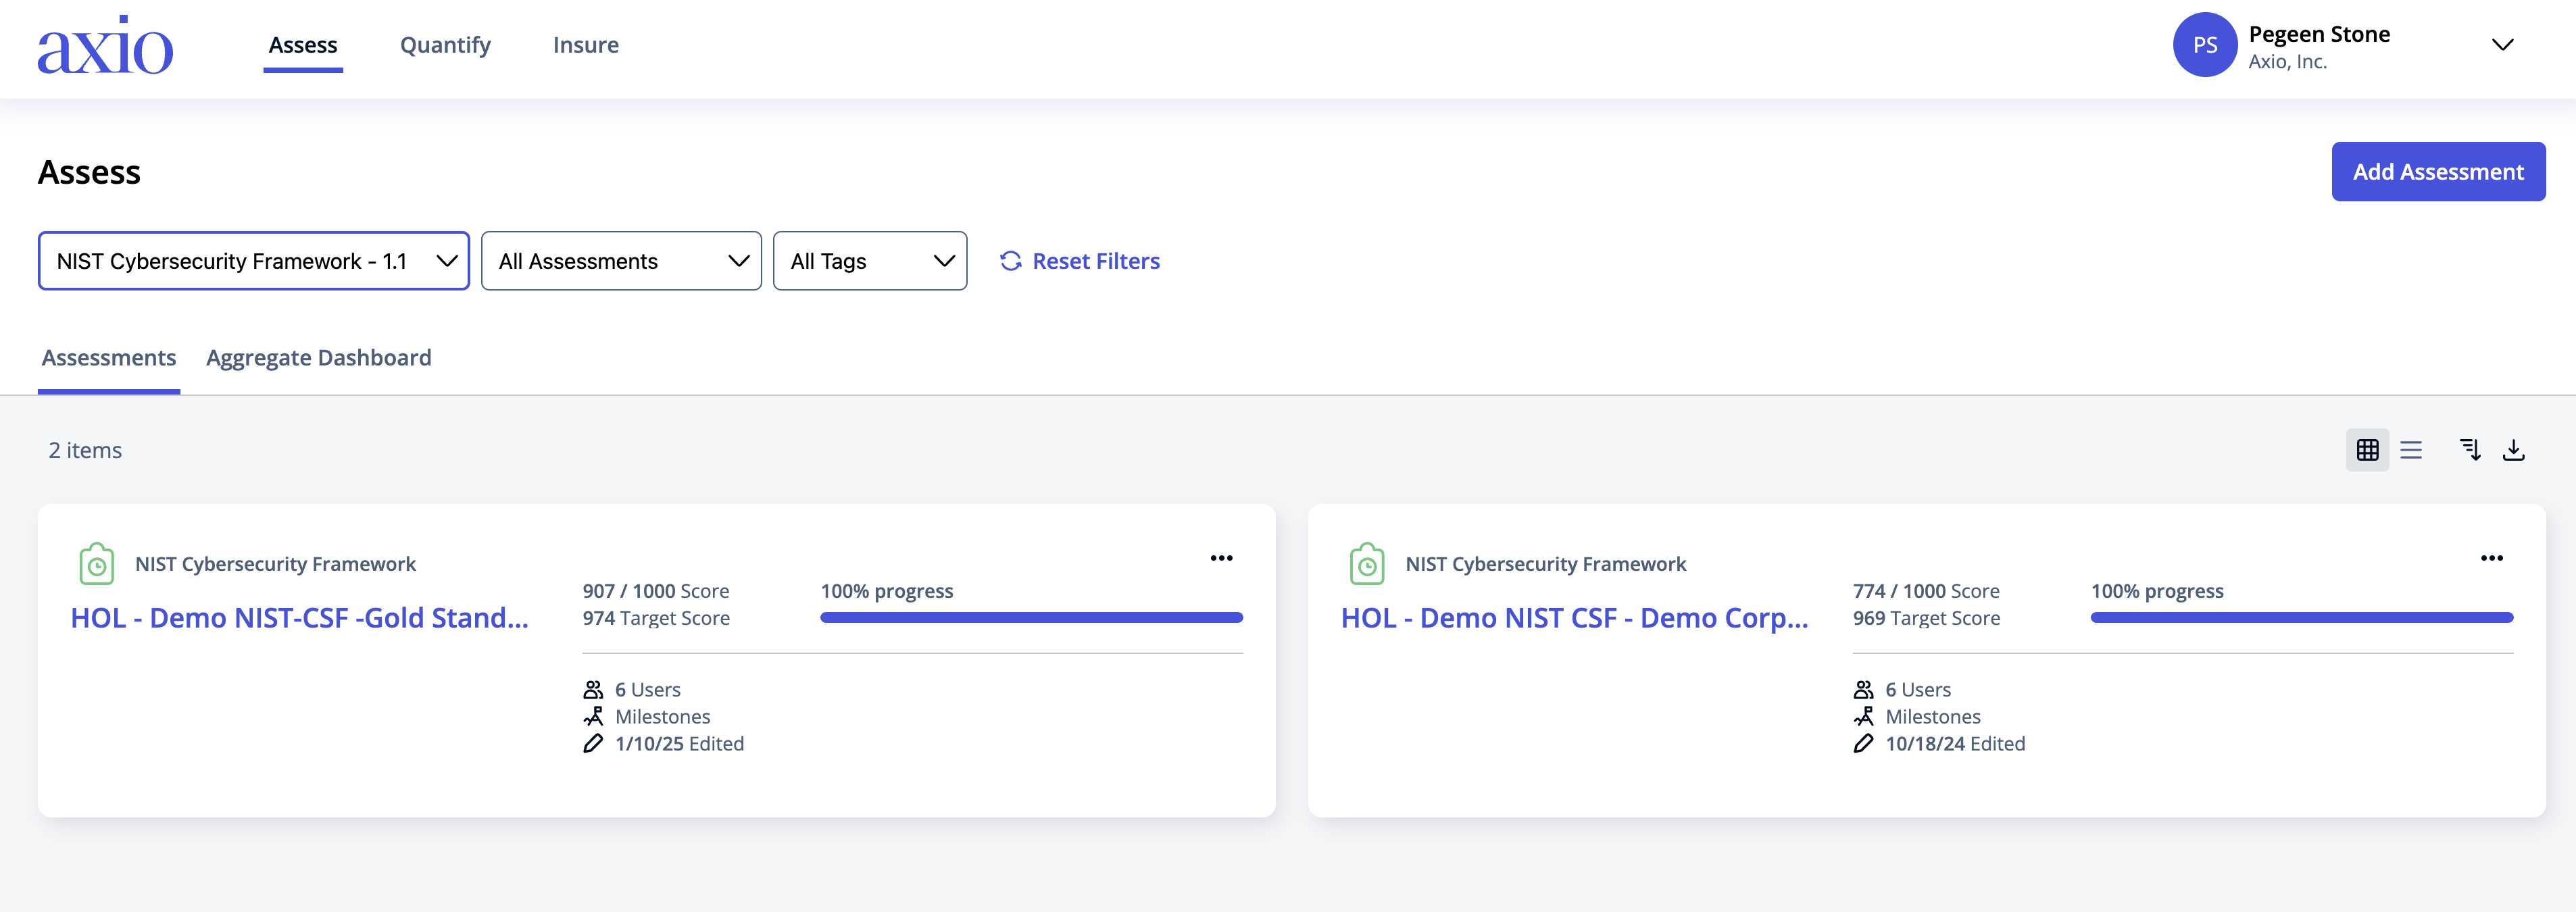
Navigation & Filtering
The top section of the module landing page includes filter options for quick access to available assessments. Users can filter by: Assessment Type, Assessment and Tags
-
Assessment Type: Displays assessments based on frameworks licensed to the user's company.
-
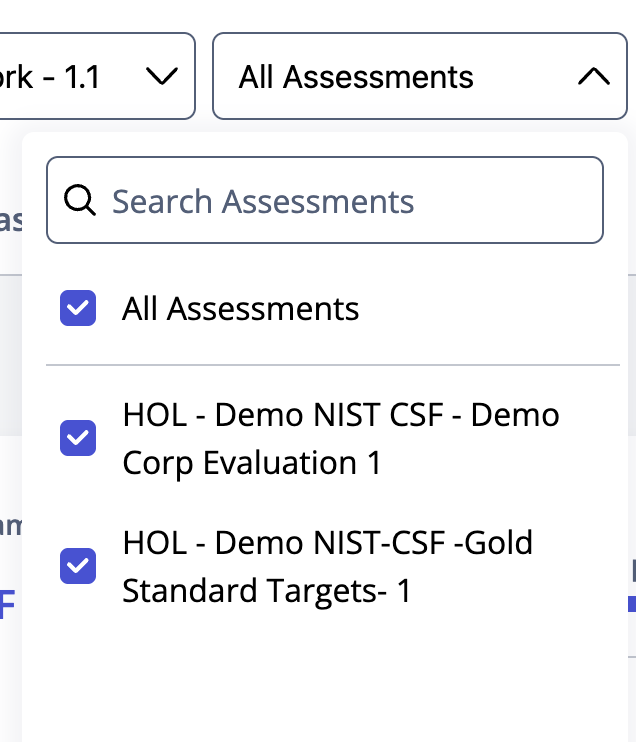
Assessment: Lists assessments that the user can access, either as an owner or through sharing.
-
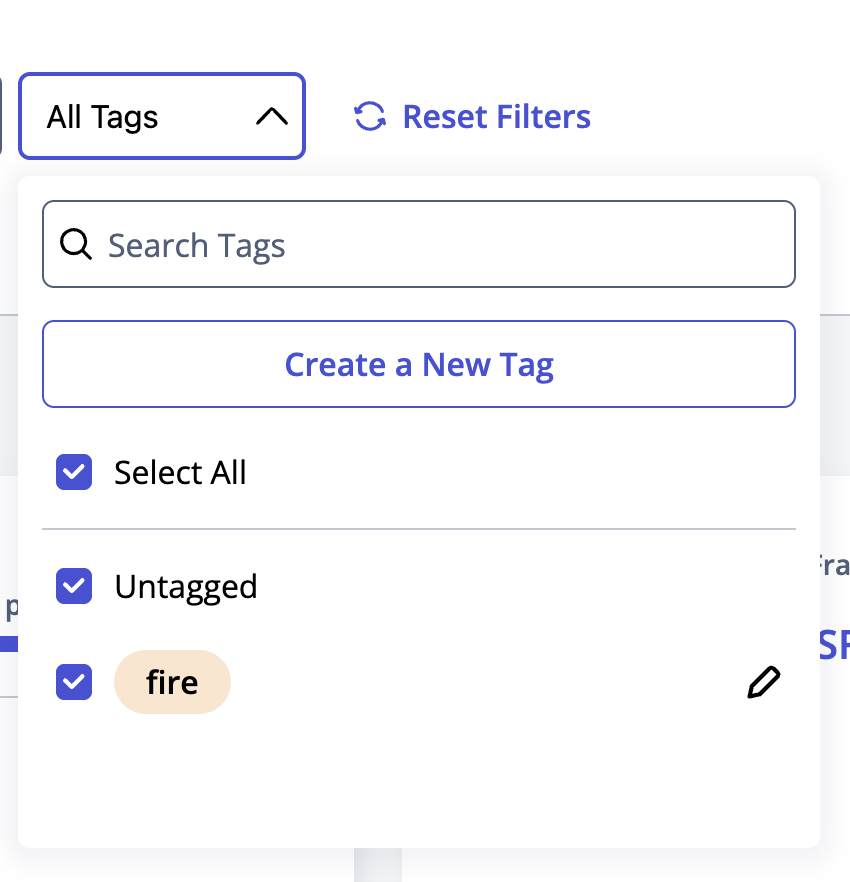
Tags: User-defined tags for organization.
Understanding Assessment Tiles
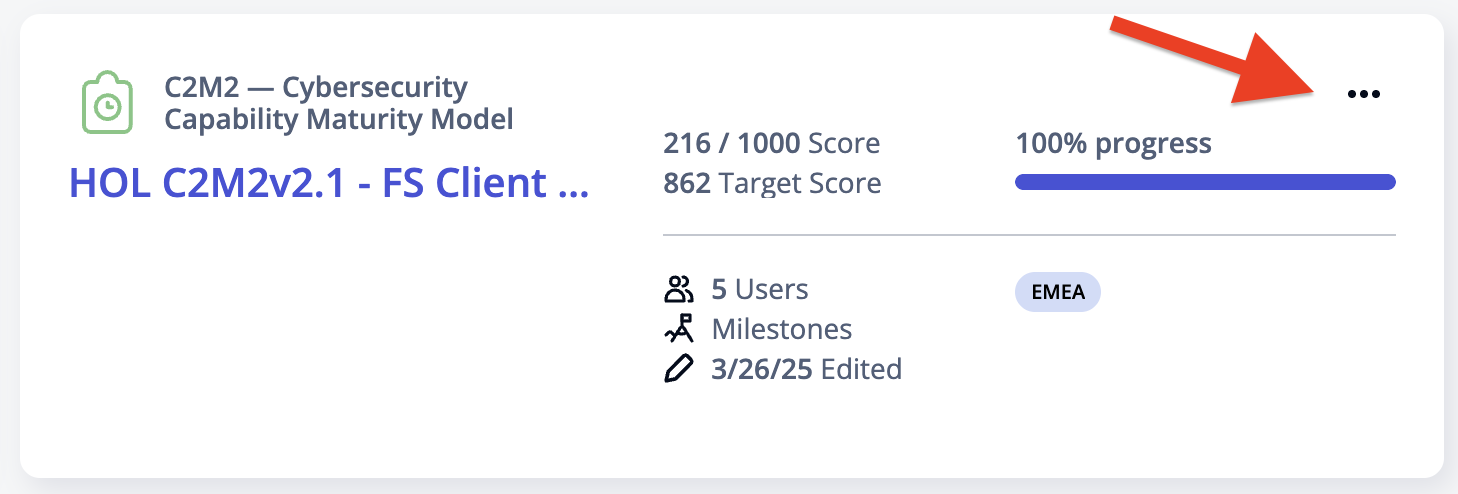
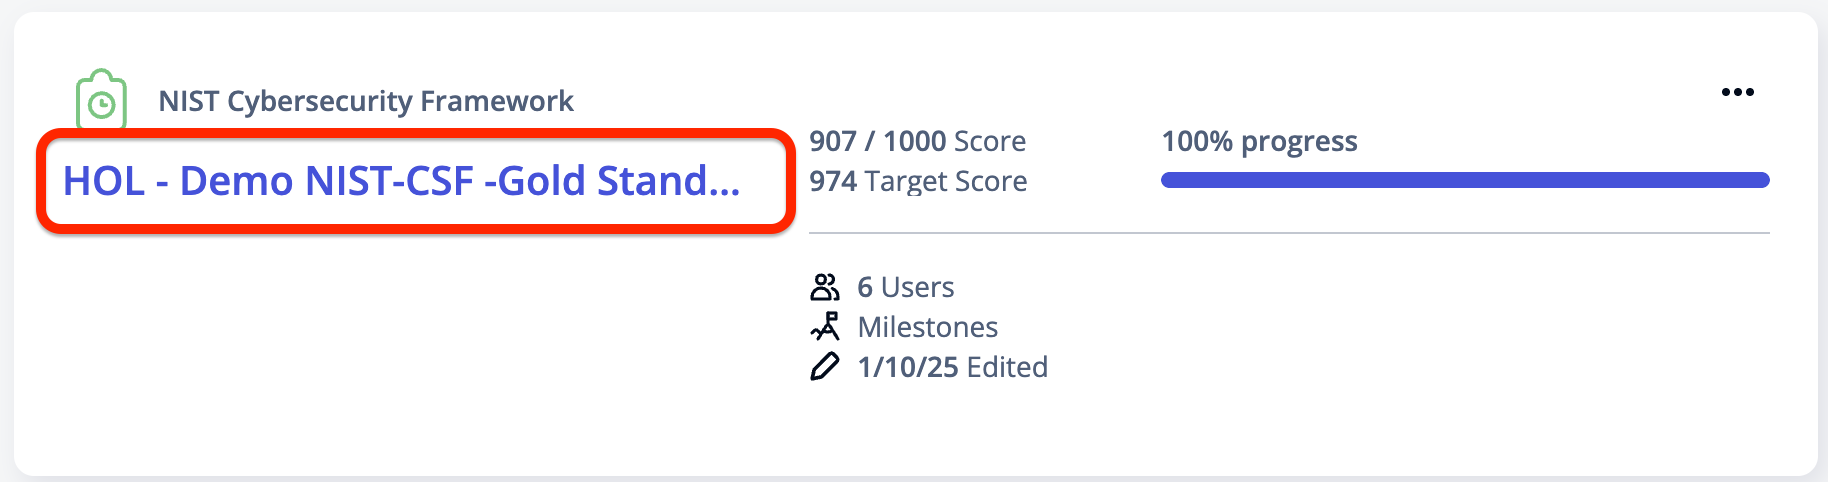
Each assessment tile provides key information if they have been set at the Assessment Level: Framework Model Name, Assessment Name, Current vs. Possible Score, Target Score, Completion Percentage, Share Count, Milestones , Last Edited Date
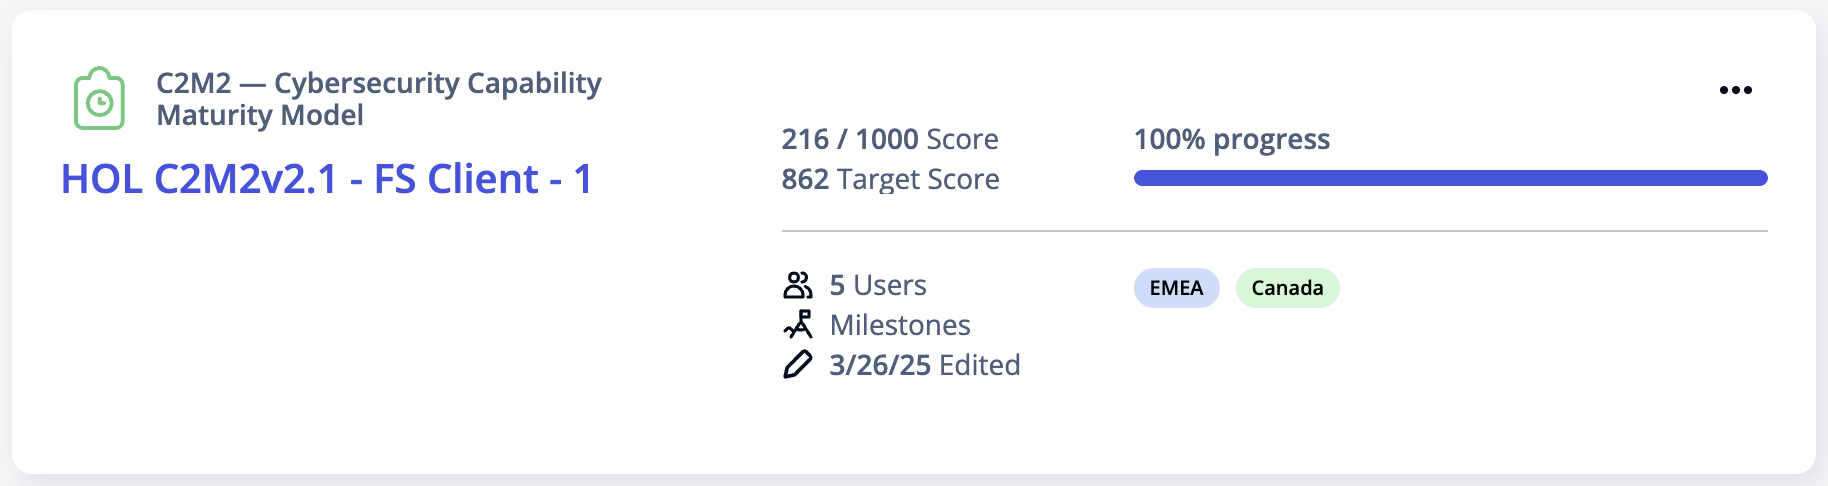
-
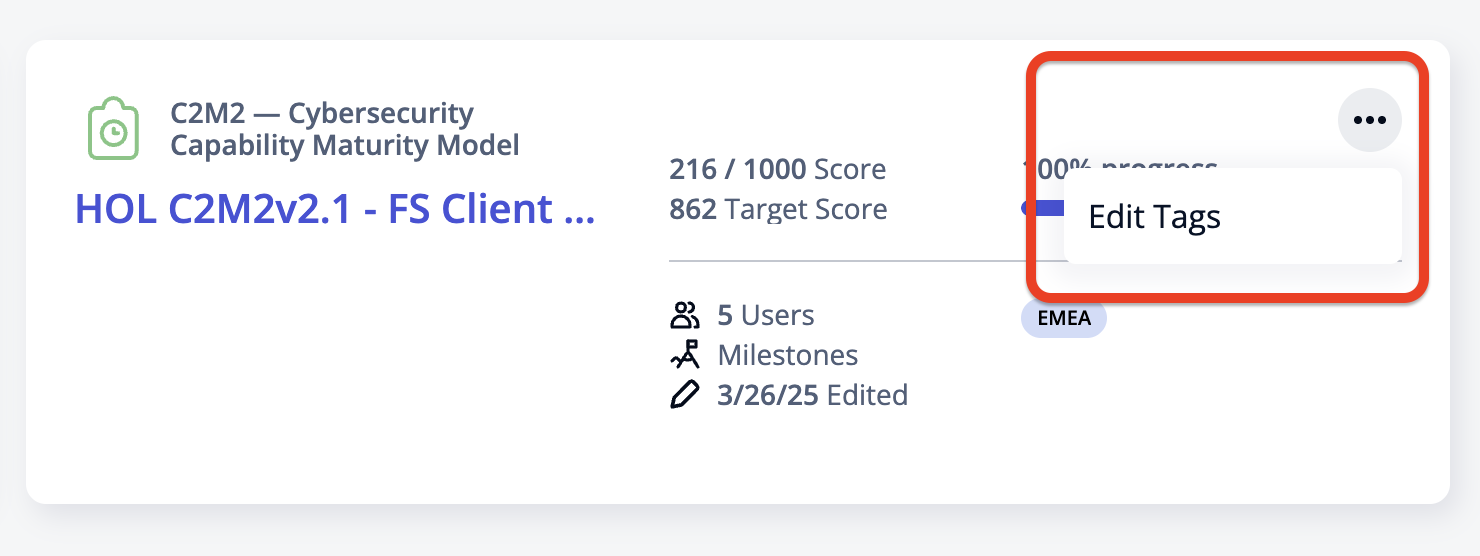
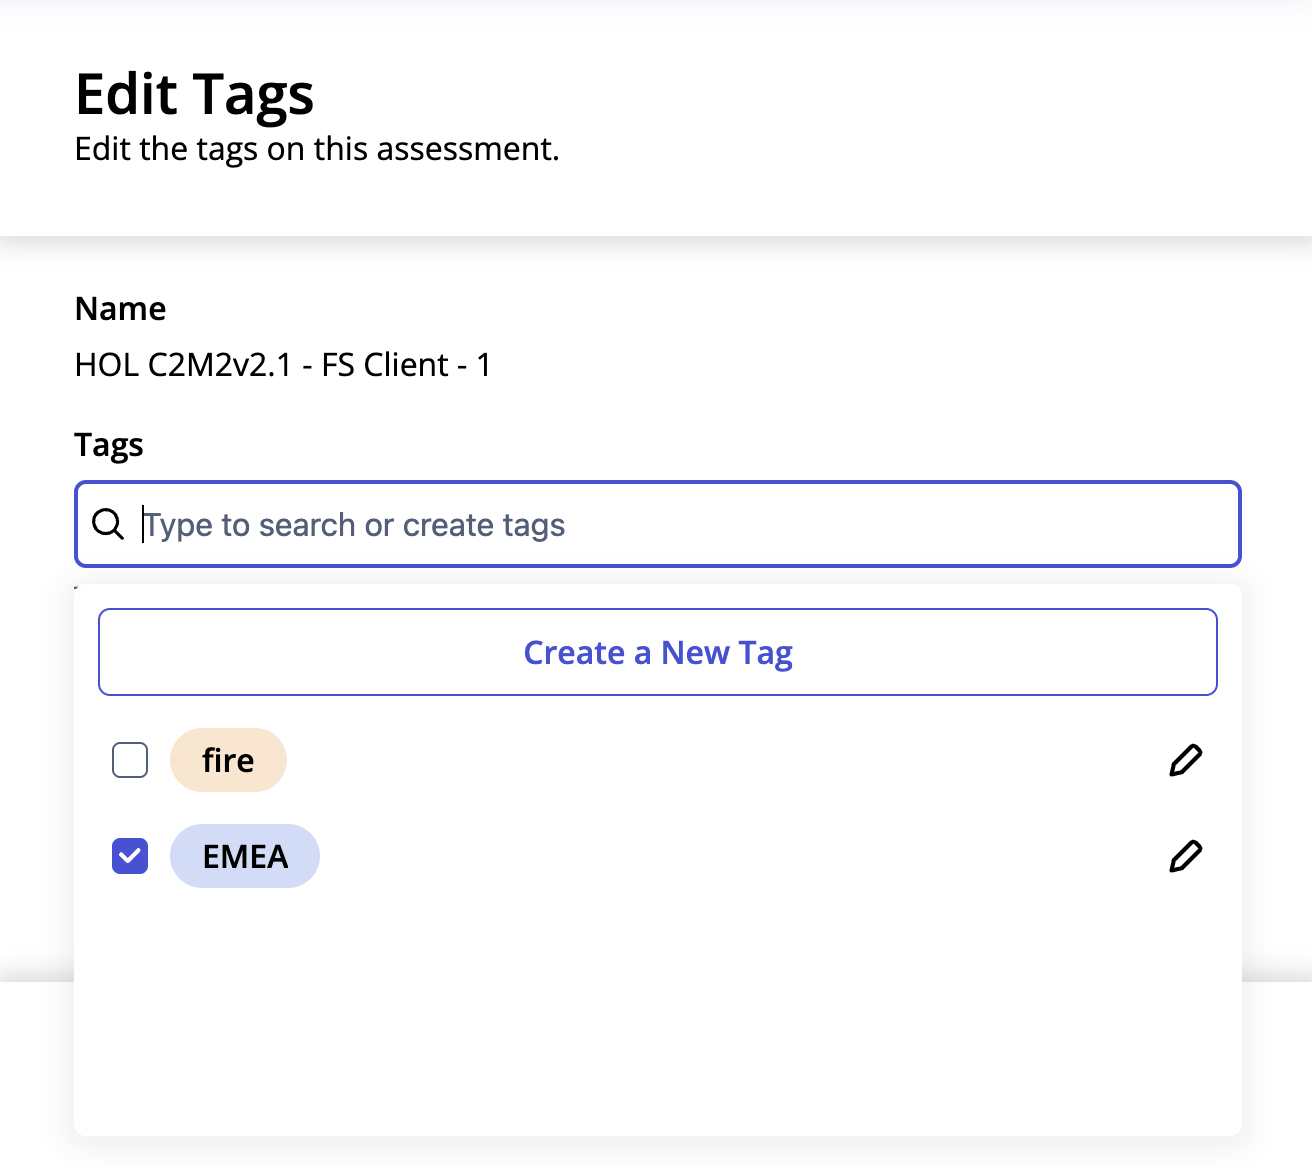
Add a Tag: Click the ellipsis menu on an assessment tile to open the tag drawer. Search for a tag, select it, and save.
-
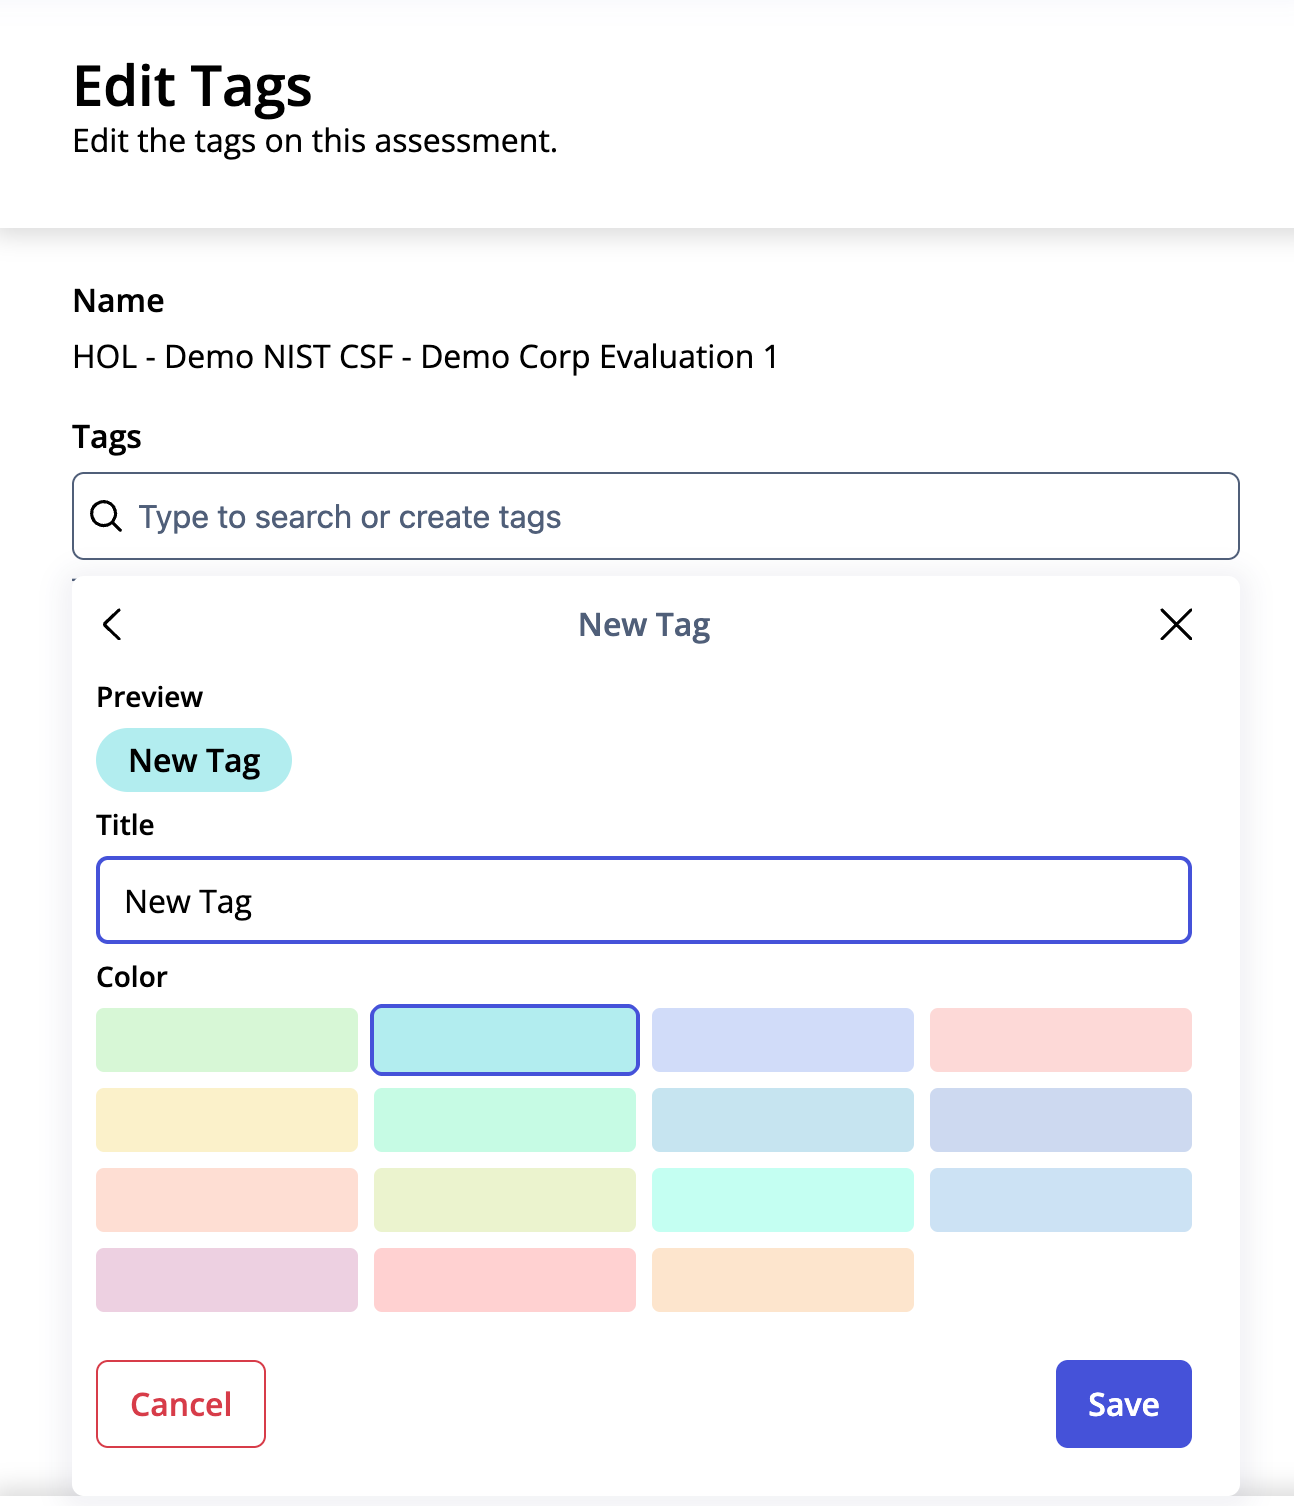
Create a New Tag: Click the ellipsis menu, select Create New Tag, enter a name, choose a color, and save. The tag will be available for future assessments.

Assessment Dashboard
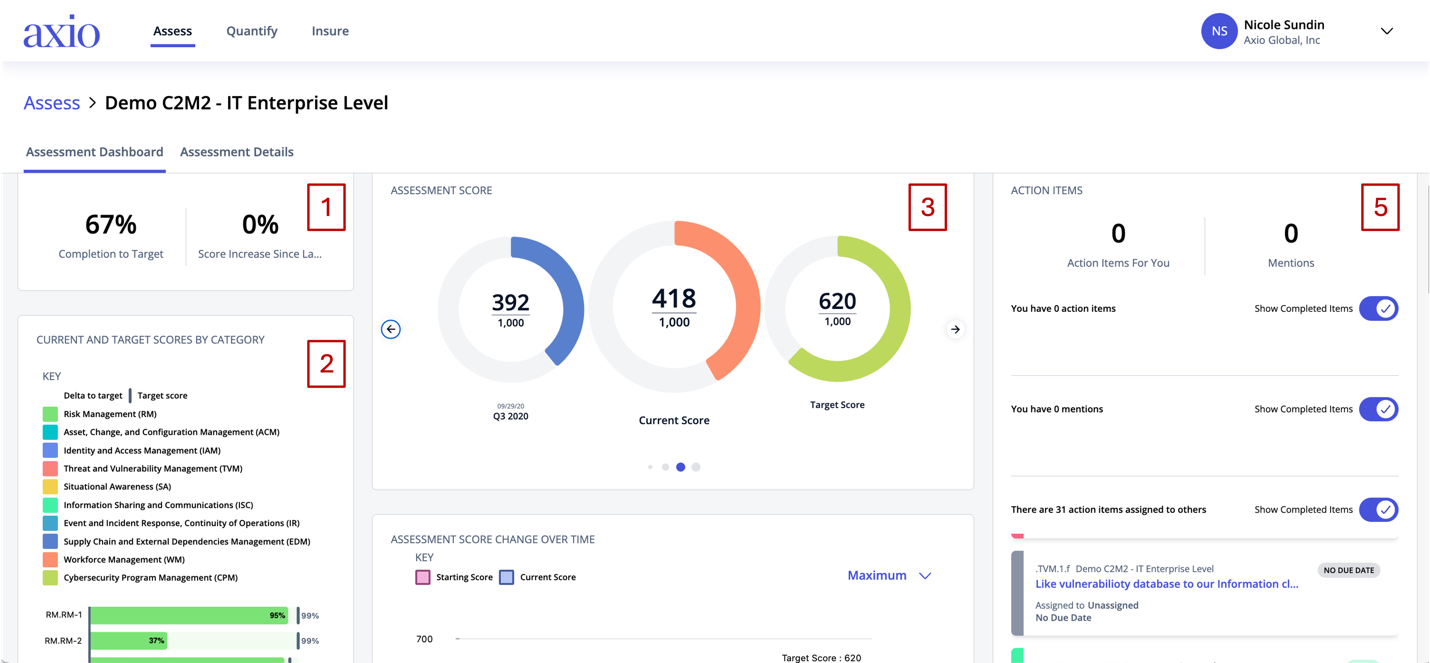
Clicking on an Assessment Overview Card navigates the user to the Individual Assessment Dashboard, which provides in-depth assessment details.
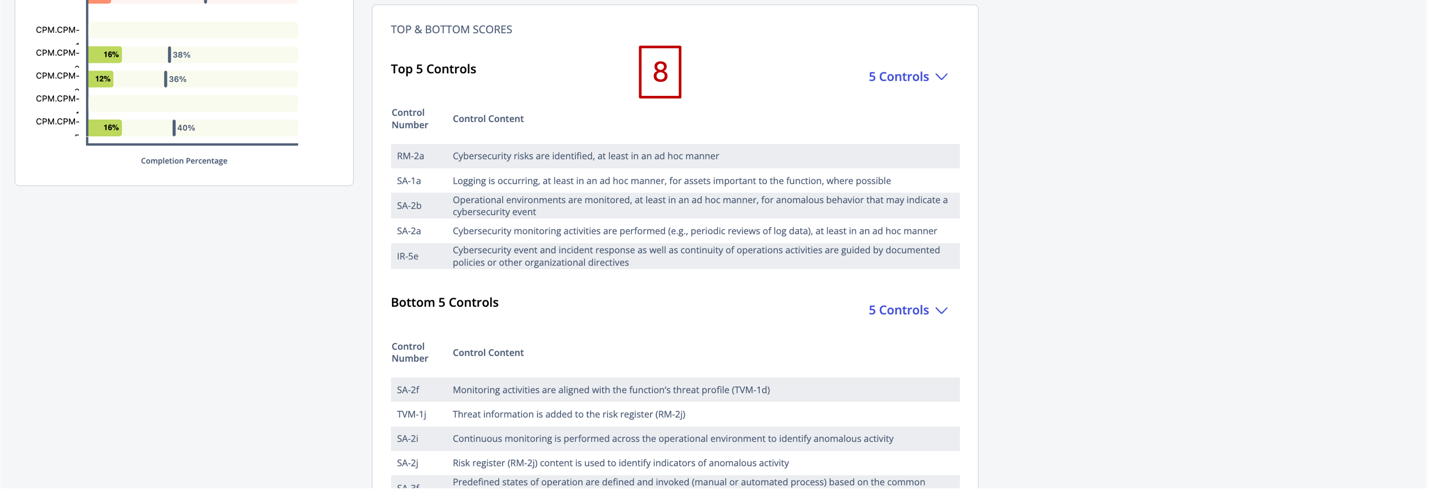
Dashboard Widgets
-
Assessment Completion Status: Displays completion percentage and score progress since the last update.
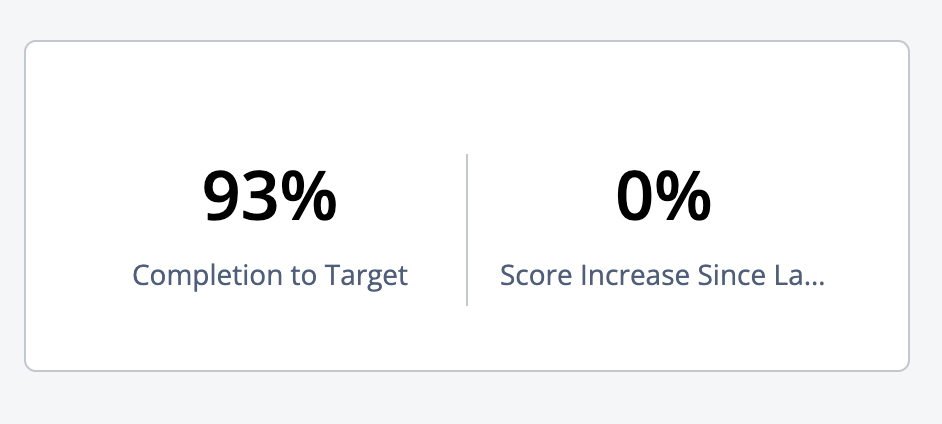
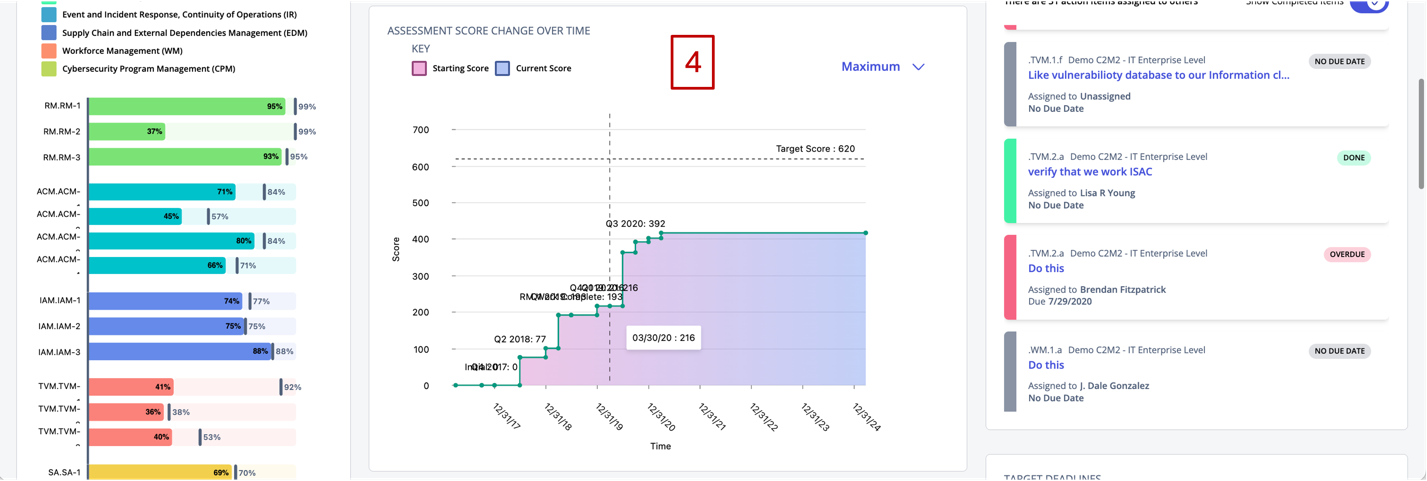
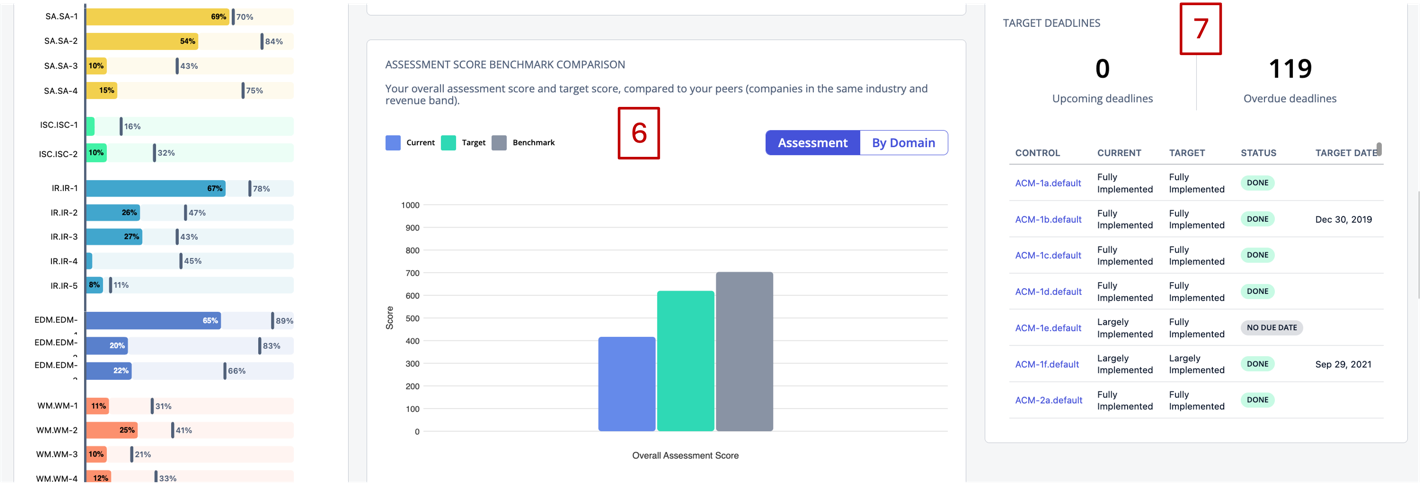
- Current & Target Scores by Category: A bar chart visualizing scores in percentage.
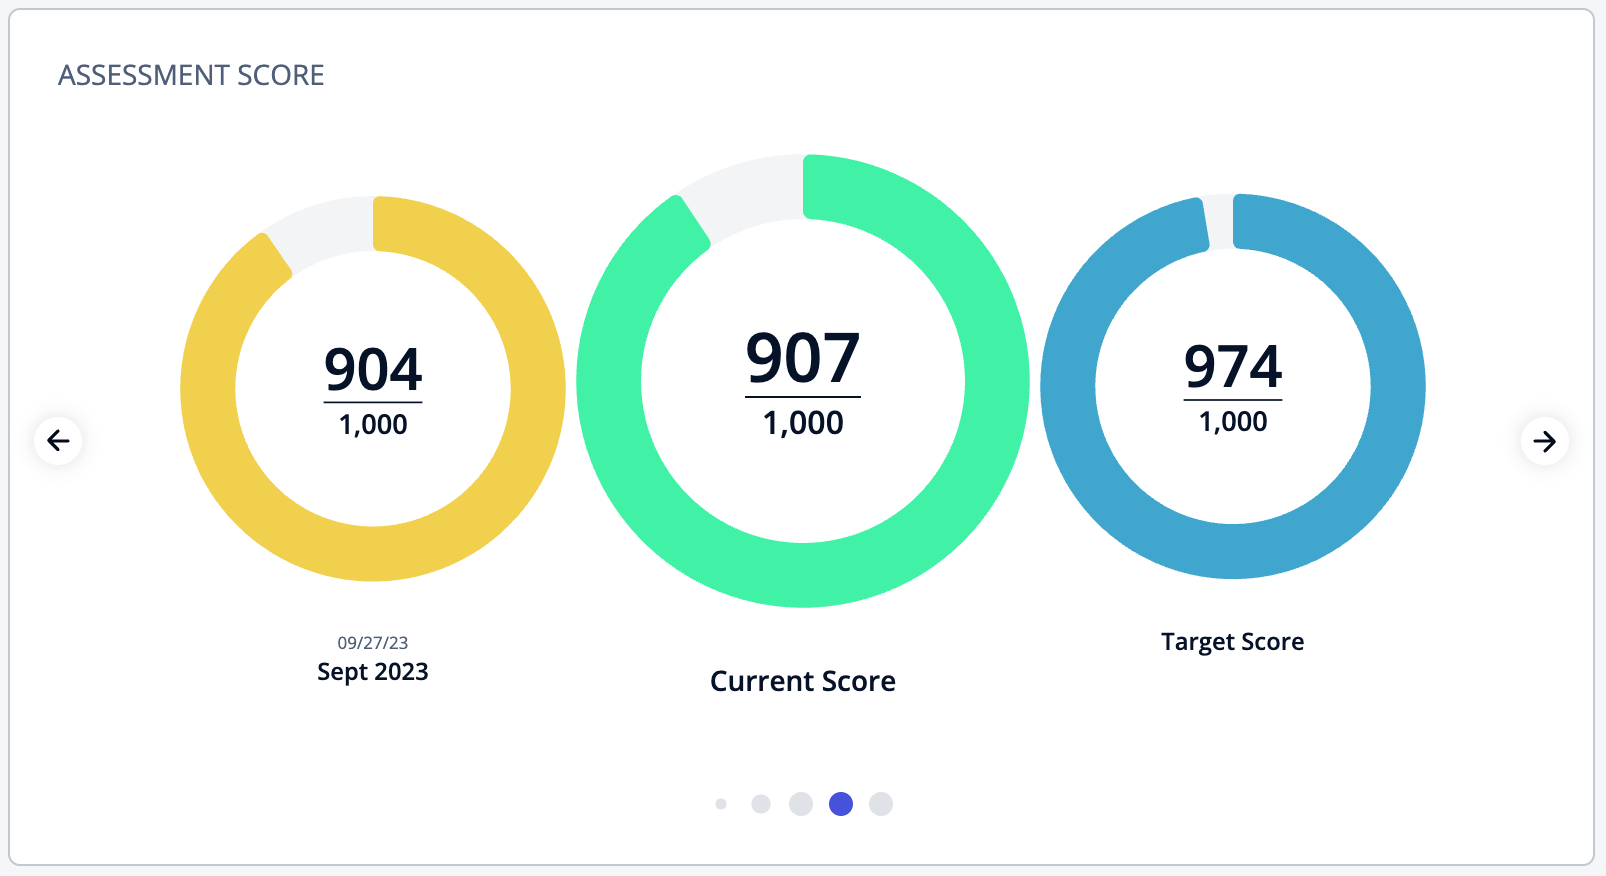
Assessment Score: A carousel displaying current and target scores over the model's base score (donut chart visualization)
-
Assessment Change Over Time: A time-based graph visualizing score progression (current scores in blue, target scores in green).

Aggregate Dashboard
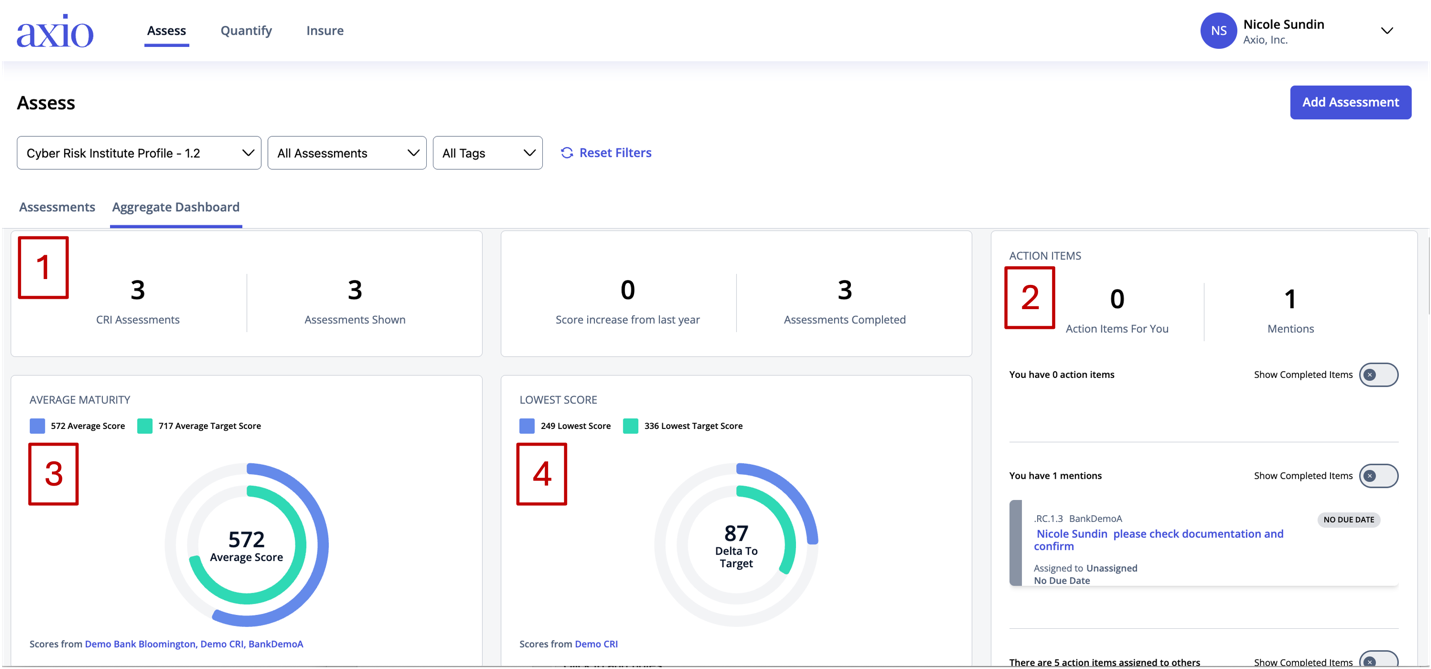
The Aggregate Dashboard Tab provides an overview of all filtered assessments in aggregate.
Widgets & Features
-
1. Query Value Widgets: Show the number of assessments included in the aggregate dashboard and total assessments in Axio360.
-
2. Action Items: Displays action items assigned to the user across all assessments.
-
Toggle to show completed items, mentions, and other users' action items.
-
3. Average Maturity: Aggregated maturity level across assessments.
-
4. Lowest Score: Highlights the lowest recorded assessment score.
-
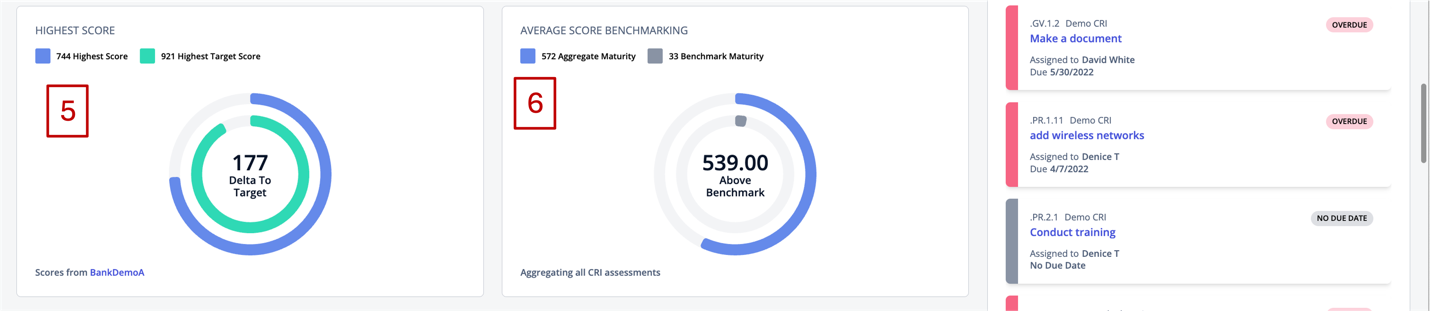
5. Highest Score: Displays the highest recorded assessment score.
-
6. Average Score Benchmarking: Compares assessment scores against benchmark data.
-
7. Assessment Progress Against Score & Target: Shows progress toward target scores.
-
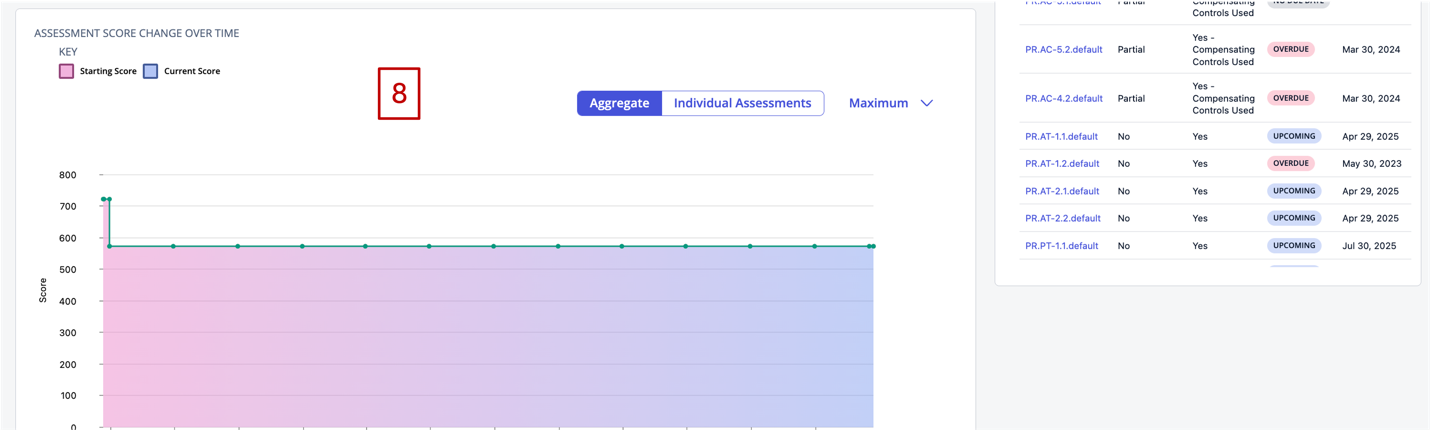
8. Assessment Score Change Over Time: Time-based visualization of assessment score changes.
-
9. Target Deadlines: Displays upcoming, due, overdue, and completed deadlines.
-
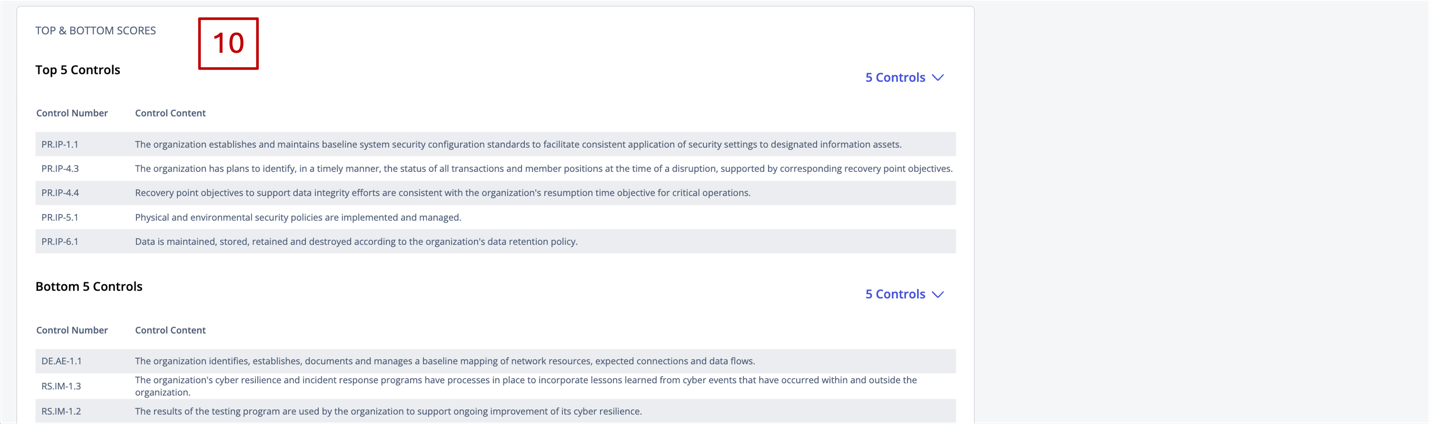
10. Top & Bottom Scores: Lists the 10 highest and lowest assessment scores.